Forecasting in Oncology: Navigating Complexity with Precision
Oncology forecasting demands a high level of granularity and adaptability. Done well, it becomes a powerful tool to inform clinical strategy, market planning, and commercial execution.
A strong oncology forecast doesn’t just quantify patients—it tells the story of their treatment journey.
Forecasting in oncology requires a nuanced, layered approach. Unlike many other therapeutic areas, oncology is defined by progression—of disease, of treatment options, and of data complexity. Patients move through multiple lines of therapy, often receiving combinations of treatments tailored to disease stage, biomarker status, and individual response. This progression adds complexity—but also opportunity— to build a model that reflects clinical reality.
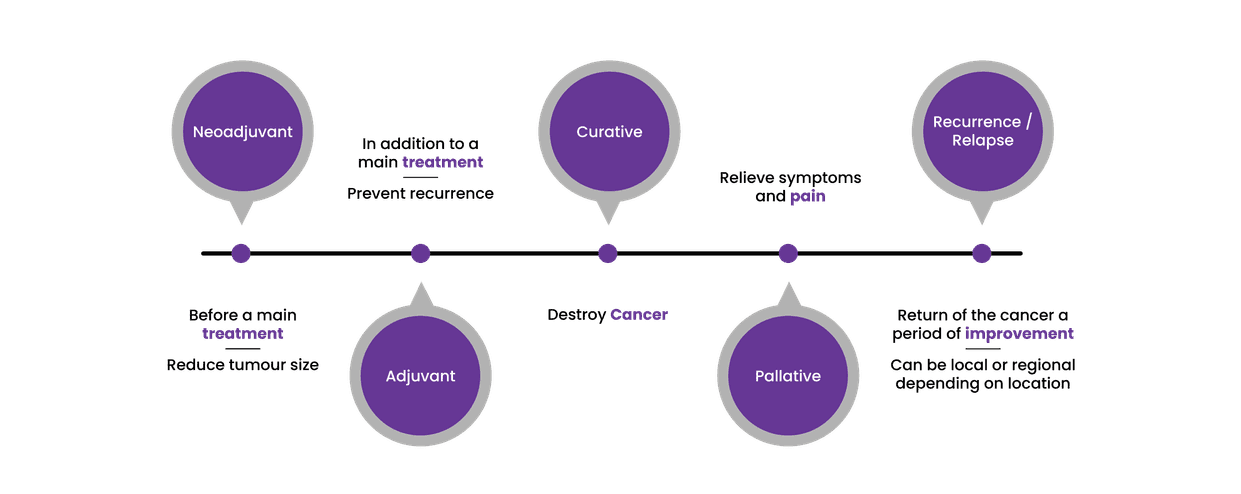
Cancer is typically staged using the TNM and numeric staging systems, designed to indicate how far a cancer has spread. Each stage—from 0 to 4—brings different treatment implications. Importantly, patients may receive several lines of therapy across their treatment journey, including neoadjuvant, adjuvant, curative, or palliative interventions. Forecasting models must account for these stages and the transitions between them.
Recurrence or relapse is another key element. These terms refer to the return of cancer after a period of remission, and can be further refined into local, regional, or distant recurrence. Being able to track and quantify these events is essential to accurately modeling patient flows and estimating therapy demand over time.
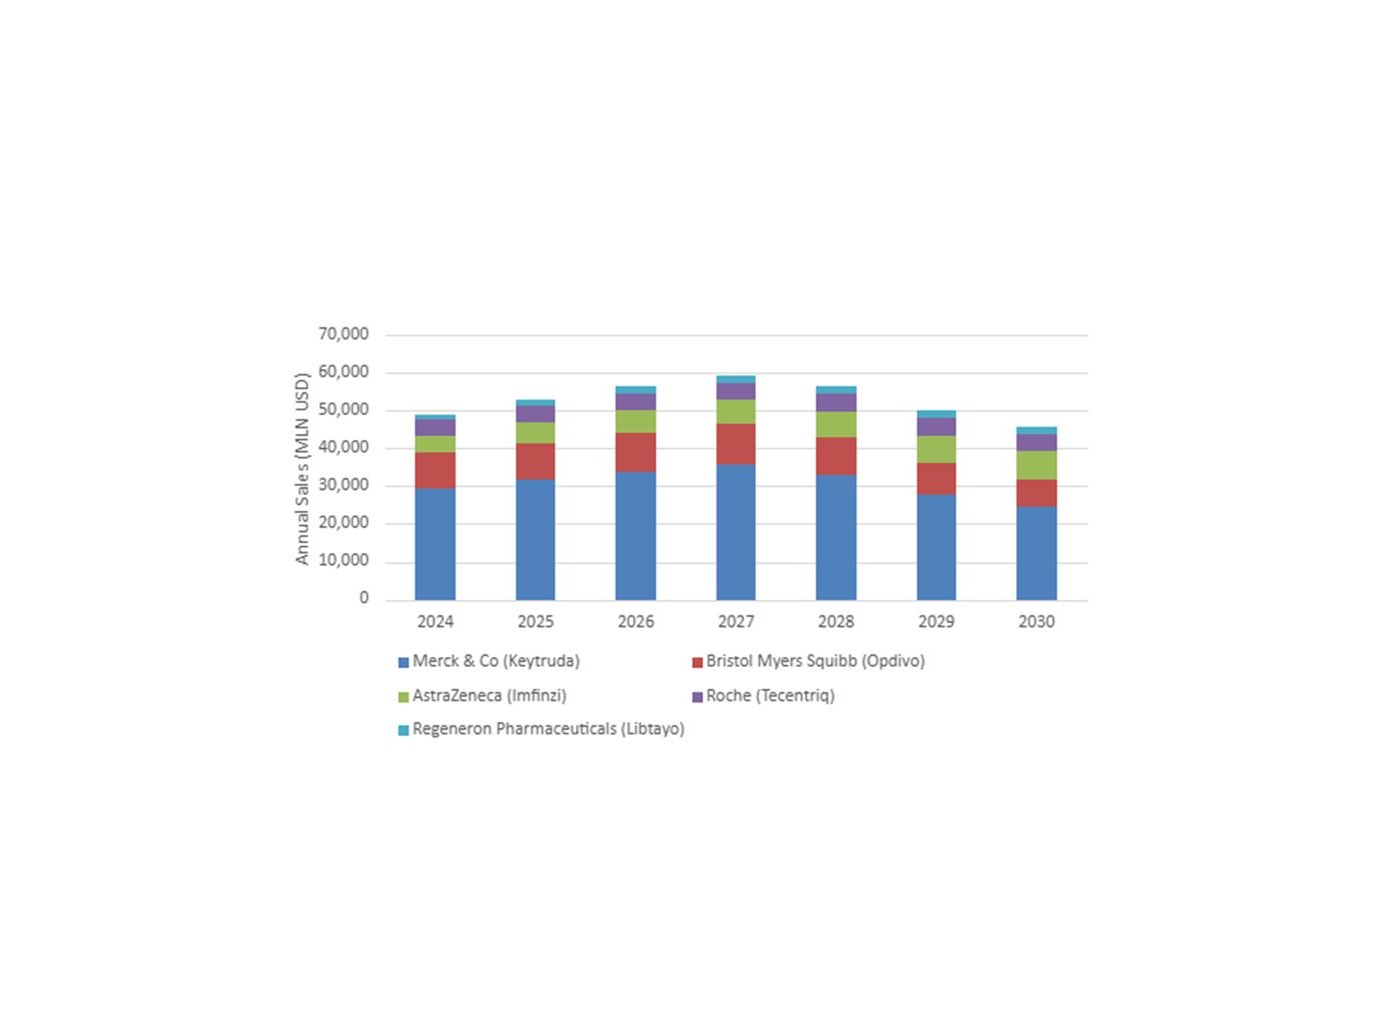
(Source: Evaluate Pharma)
Biomarkers have transformed oncology by enabling personalized medicine. They help determine not only who is eligible for certain therapies, but also how patients are likely to respond. In forecasting, biomarker data typically sits within the epidemiology or patient definition sections of the model, allowing for precise segmentation and sizing of your target population.
One of the most widely targeted biomarkers in oncology today is PD-1. Therapies aimed at PD-1 have rapidly expanded across indications including melanoma, non-small cell lung cancer, and bladder cancer, significantly changing treatment dynamics and forecastable patient populations. [See: Epidemiology section – for defining patient populations using biomarkers and disease prevalence]
Progressive Disease
Patients progress through stages of disease and lines of therapy, each with distinct treatment options. Patient flow methodologies are essential, modeling how patients move from diagnosis through successive lines of treatment—often using inputs like length of therapy, persistency rates, and progression assumptions.
Tip: Ensure you’re forecasting the right patient group by carefully defining your market based on diagnosis, stage, and line of therapy.
[Related: Patient Flow Forecasting section]
Treatment Exclusions
Forecasting must also factor in prior treatment use. Many oncology therapies can only be used once per patient, or have restrictions based on previously administered agents. This limits the pool of eligible patients for second-line and later therapies.
Tip: Avoid overestimating uptake by building treatment sequencing rules into your model.
Targeted Therapies
The oncology landscape is increasingly segmented. New agents often target specific patient subgroups, such as those with particular mutations or biomarker expressions. Forecasting must reflect this stratification, along with evolving standards of care.
“The rise of PD-1 therapies shows how fast oncology treatment paradigms can shift—and why your forecast must adapt.”
Top 5 PDL-1 Therapies by Annual Sales
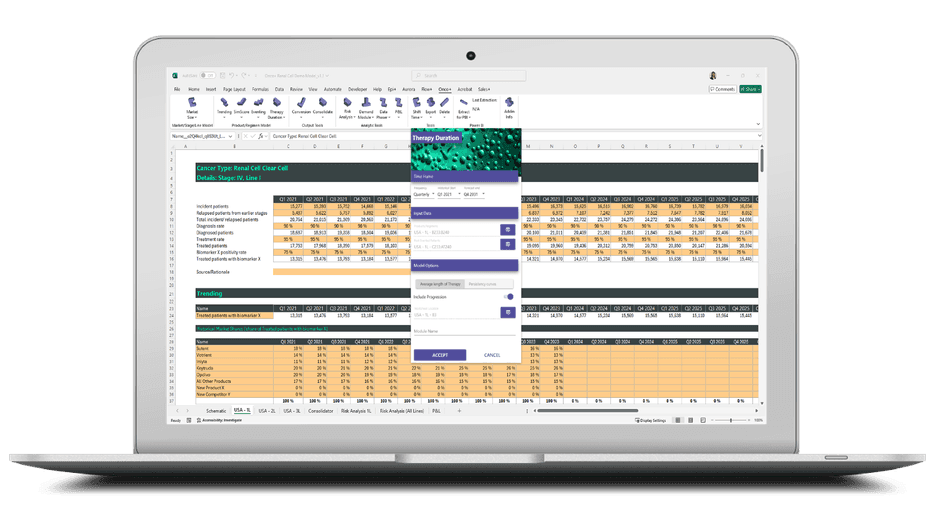
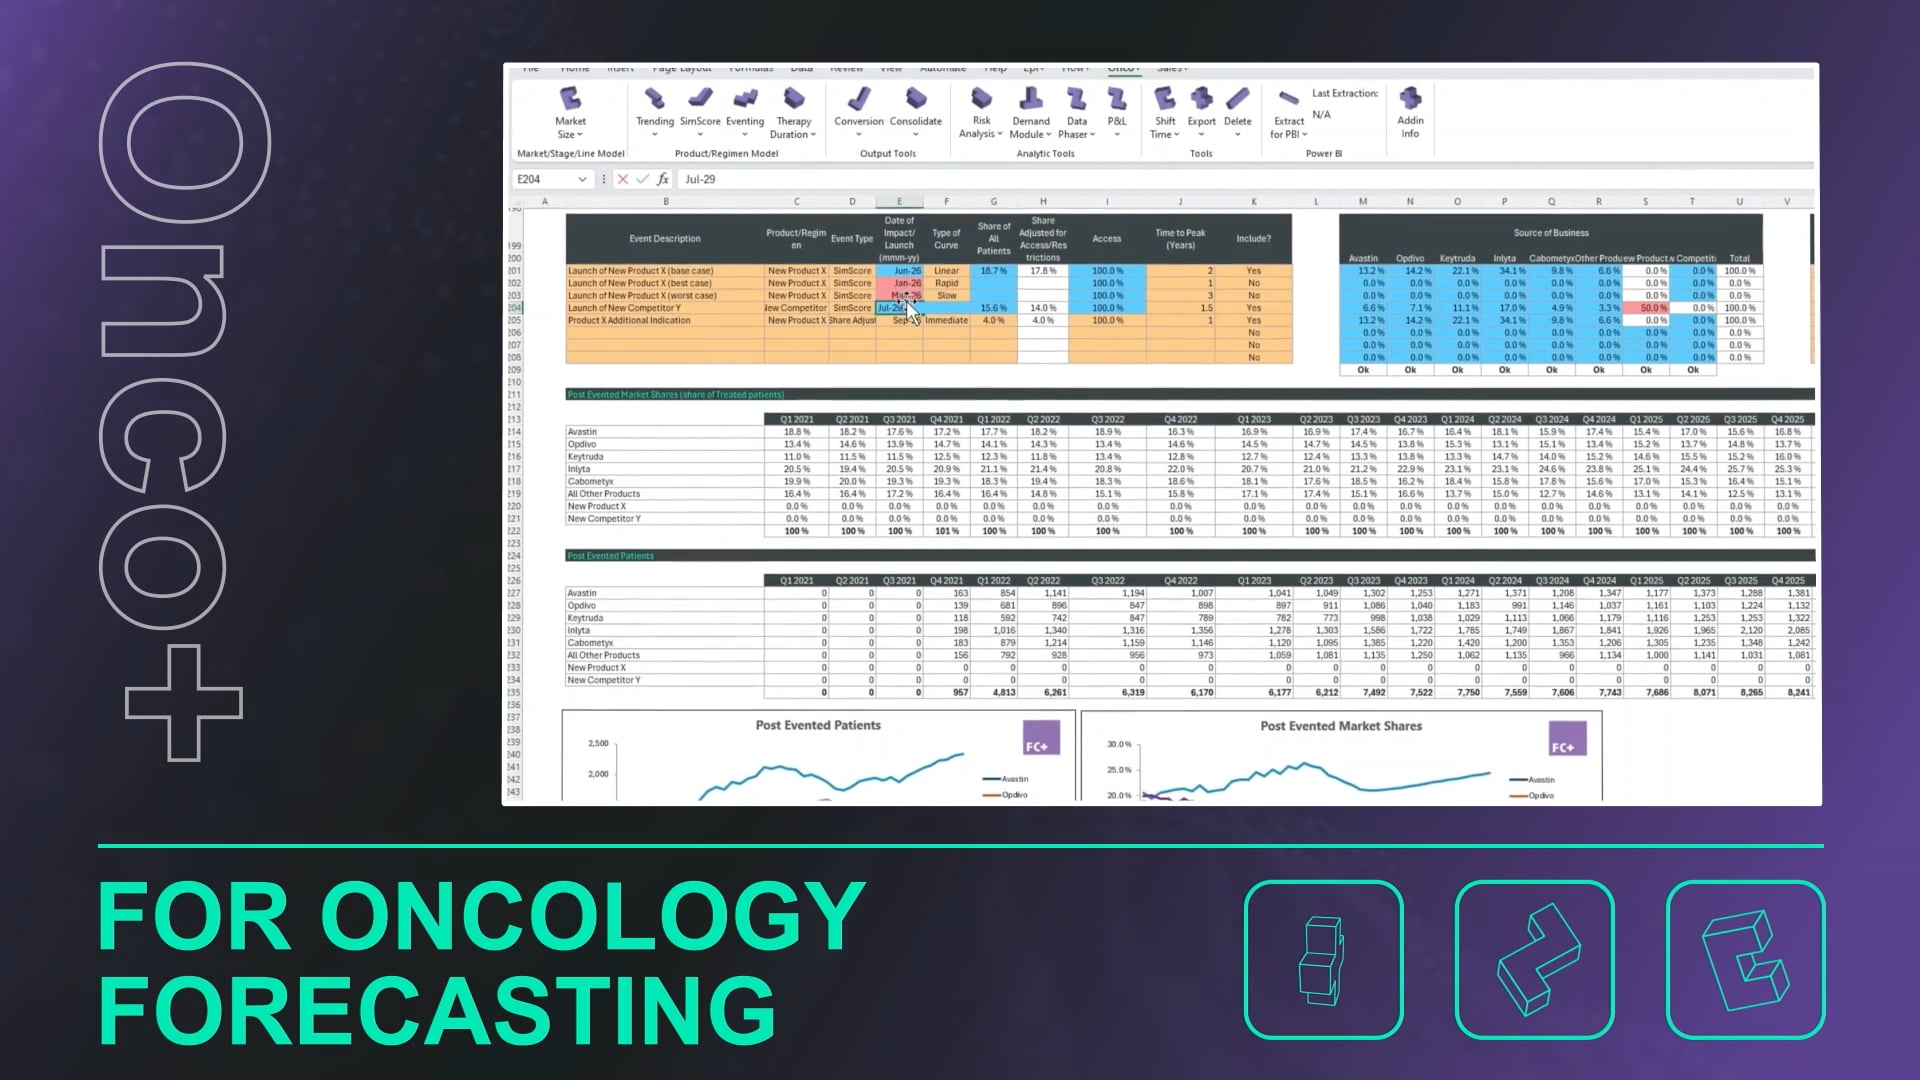
Advanced software that redefines how you forecast.
Take a Look
A unique software with unparalleled capabilities in oncology forecasting. Discover how it can transform your forecasting processes.
In melanoma, for example, the approval of several novel therapies has more than tripled the treated population in recent years, as clinicians now have more—and better—options to choose from.
Oncology treatments can be oral or infused, and dosing often depends on body weight or surface area. In addition, forecasting may occur at the regimen level (e.g., combination treatments), which requires conversion to product-level units before applying volume and revenue assumptions.
Tip: Be explicit about your assumptions when moving from regimens to SKUs—precision here helps avoid major miscalculations downstream.
Beyond the basics, your model should also account for:
Treatment holidays
Changes in therapy persistency
New entrants to the treatment landscape
The cumulative effect of prior therapy decisions on future treatment eligibility
Find out how we help
Oncology is dynamic, data-rich, and constantly evolving. A strong forecast brings clarity to this complexity—ensuring development, commercial, and access strategies are grounded in realistic, data-driven assumptions.